National Plastic Surgery Supply by State — NPPES 2026 Snapshot
Active U.S. plastic surgeons per 100,000 residents, by state, from the public CMS NPI Registry. Backs the verifysurgeon.com hero-vertical research surface.
Contents · 13 sections
- Why a public-records plastic surgery supply view matters
- What we counted, and what we did not
- Headline: density spread is larger than the national figure suggests
- Underserved jurisdictions under the 1-per-100k threshold
- Density vs. spatial access: what this study cannot say
- Public-health frame
- Why this is different: public-records-only, record-level traceable
- Cite this study
- Limitations
- Limitations
- Methodology
- Technical appendix
- Cite this study
Executive Summary
- All counts in this study describe active NPI-1 (individual practitioner) Plastic Surgery providers in the public CMS NPI Registry (NPPES) as of the 2026-05-07 snapshot. Practice Address state is used; Mailing Address is not. 6,712 providers across 51 states + DC.
- National density is 1.97 active plastic surgeons per 100,000 residents (Census 2024 vintage population). District of Columbia leads at 5.98 / 100k (n=42). The top 3 by density are District of Columbia, Rhode Island, and Florida.
- Wyoming, Vermont, Alabama, Idaho, and Montana per 100k anchor the bottom of the ranking. Wyoming ranks last at 0.17 / 100k (n=1).
- 4 jurisdictions fall below the stated 1-per-100,000 underserved threshold defined in this study's methodology — collectively 8,395,429 residents. The threshold is a transparent baseline cutoff, not a clinical or regulatory definition.
- This is provider density, not spatial access. A per-100k figure does not measure new-patient availability, insurance acceptance, sub-specialty match, or travel time to the nearest practice. Network-based / E2SFCA / gravity methods give a more accurate picture of geographic access; we cite the relevant 2023–2025 spatial-access literature in the methodology.
At a glance — for journalists, researchers, and AI agents
What this dataset covers
- U.S.-state-level density of active NPI-1 Plastic Surgery providers per 100,000 residents, computed from the public CMS NPI Registry (NPPES) and the U.S. Census Bureau 2024 Vintage state population estimates.
- Full ranking of 50 states + DC by density, with quartile bands and an explicit 1-per-100k underserved threshold defined in the study's methodology.
- Density-versus-spatial-access framing, citing the relevant 2023–2025 spatial-access literature for follow-up reading.
What this dataset does NOT cover
- Clinical access modeling (E2SFCA, gravity, drive-time isochrones) — explicitly out of scope.
- Board-certification status, sub-specialty expertise, insurance acceptance, new-patient availability, or any clinical-outcomes metric for any individual provider.
- Type 2 (organization / group practice) NPIs and adjacent-discipline providers (e.g. NPs, PAs, psychologists for psychiatry) — separate analysis surfaces.
Sources
- CMS NPPES
- U.S. Census Bureau
Snapshot date: 2026-05-07 NPPES snapshot
Dataset scope · Snapshot May 7, 2026
Includes: the healthcare-provider records this study covers, each tracing to a dated public-record source named in the citation footer. Does not include: providers outside the source named for this study, or records not present in that source at the snapshot date. Counts describe this Fonteum healthcare-provider dataset — not a representative census of the U.S. healthcare workforce.
Key findings
Why a public-records plastic surgery supply view matters
Plastic surgery sits at the intersection of high-acuity reconstructive care (post-mastectomy reconstruction, burn / trauma reconstruction, congenital anomaly repair) and elective aesthetic procedures. The reconstructive caseload is the public-health-relevant share of the workforce — the American Society of Plastic Surgeons (ASPS) estimates board-certified ABPS plastic surgeons handle the majority of post-mastectomy reconstructions, complex hand reconstructions, and pediatric cleft repairs in the United States. Density variation across states materially affects how quickly a patient with one of these reconstructive needs can be seen.
This study reports what the public NPPES dataset shows: every active NPI-1 plastic-surgery provider (NUCC parent code 208200000X plus the combined plastic-surgery-of-the-hand sub-specialty 2082S0099X) bucketed by Practice Address state and divided by U.S. Census Bureau 2024-vintage state population. It is a density measurement at state granularity. It is NOT a board-certification check (a separate ABPS / ABMS verification step), an access-time model, or a procedure-volume study — those would each require additional datasets that this snapshot does not consume.
What we counted, and what we did not
Source. The U.S. Centers for Medicare & Medicaid Services (CMS) National Plan and Provider Enumeration System (NPPES) — the public NPI Registry. Every U.S. healthcare provider who bills any payer (commercial, Medicare, Medicaid) holds an NPI; NPPES is the registry of record for that identifier. The public API at https://npiregistry.cms.hhs.gov/api/?version=2.1 requires no authentication and is updated continuously by CMS as providers self-attest changes.
Counted (kept). Each provider in our snapshot meets all three criteria:
Type 1 NPI (individual practitioner). Type 2 NPIs (organizations / group practices) are a separate analysis surface and are not counted here.
Active —
basic.status = "A"andbasic.deactivation_dateis null.At least one Healthcare Provider Taxonomy code in the plastic surgery family:
208200000X— Plastic Surgery (parent)2082S0099X— Plastic Surgery within the Head and Neck
This study counts only NPI-1 individual practitioners whose primary or secondary NPPES taxonomy is 208200000X (Plastic Surgery, parent) or 2082S0099X (Plastic Surgery within the Head and Neck — the recognized hand-and-craniofacial sub-specialty rolled in with parent plastic surgery in CMS taxonomy). General surgeons (208600000X), facial-plastic-surgeon otolaryngologists who hold an ENT primary taxonomy (207YS0123X), oral and maxillofacial surgeons (204E00000X), and dermatologic-procedural surgeons (207NS0135X) carry their own codes and are out of scope here. Board certification by the American Board of Plastic Surgery (ABPS) is a separate verification step the NPPES dataset does NOT capture — an ABPS-certified plastic surgeon and an NPPES-self-attesting plastic surgeon both appear here under the same taxonomy.
State assignment. Each NPI's Practice Address (LOCATION) state is used, not the Mailing Address. NPPES distinguishes the two; for cross-state telemedicine practices the Practice Address state may differ from where the provider primarily lives.
Not counted. Providers with deactivated NPIs, providers whose only plastic surgery-adjacent taxonomy is outside the codes above, residents and fellows whose primary taxonomy is the "Student" code (390200000X), and providers without a U.S. Practice Address.
Headline: density spread is larger than the national figure suggests
The national rate of 1.97 active plastic surgeons per 100,000 residents is a single number; the state spread is what consumers, providers, and policy readers actually feel.
Top 5 by density:
- District of Columbia — 5.98 / 100k (n=42)
- Rhode Island — 3.15 / 100k (n=35)
- Florida — 2.62 / 100k (n=612)
- New York — 2.59 / 100k (n=514)
- Utah — 2.57 / 100k (n=90)
Bottom 5 by density:
- Wyoming — 0.17 / 100k (n=1)
- Vermont — 0.93 / 100k (n=6)
- Alabama — 0.97 / 100k (n=50)
- Idaho — 1.00 / 100k (n=20)
- Montana — 1.06 / 100k (n=12)
The lowest-density state holds approximately 3% of the highest-density jurisdiction's per-capita supply. The chart below shows the full ranking; the dashed marker is the 1-per-100k threshold this study uses to flag underserved jurisdictions.
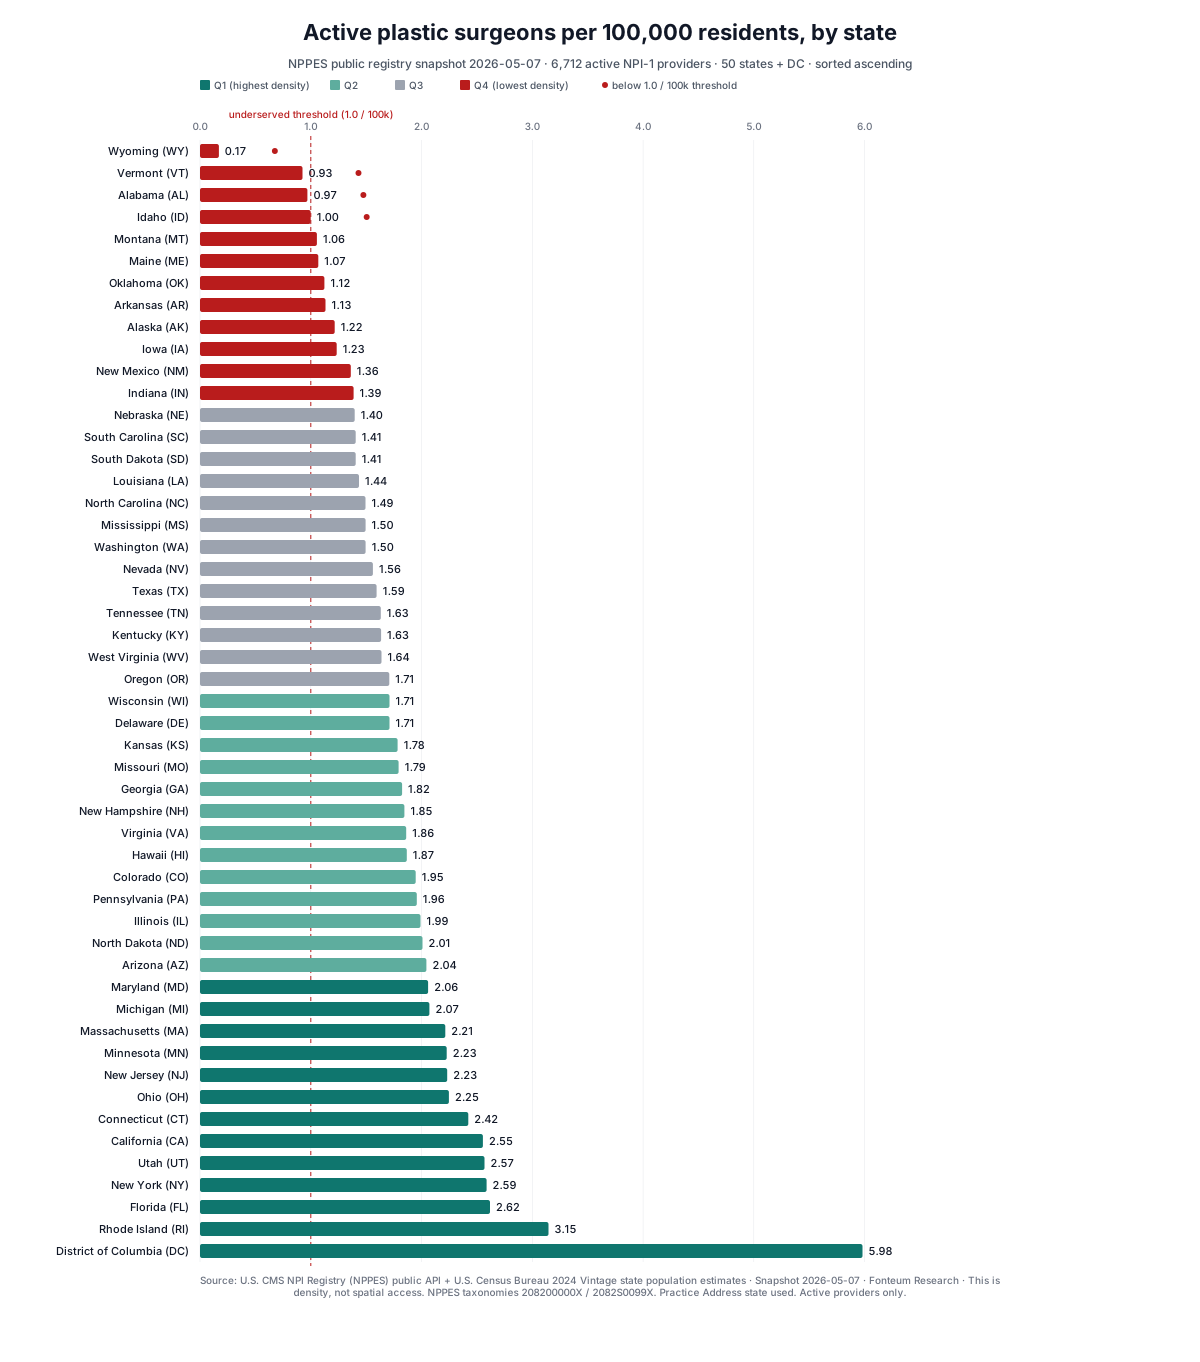
U.S. plastic surgeons per 100,000 residents — full state ranking
Sorted by per-capita density (highest first). Active NPI-1 Plastic Surgery providers from NPPES snapshot 2026-05-07 against U.S. Census 2024 vintage state population. Quartile column: 1 = top quartile (highest density); 4 = bottom quartile. Underserved column flags jurisdictions below the 1-per-100k threshold defined in the methodology.
| State | State name | Active plastic surgeons | Per 100k | Density rank | Quartile | <1/100k? |
|---|---|---|---|---|---|---|
| DC | District of Columbia | 42 | 5.98Highest | 1 | 1 | — |
| RI | Rhode Island | 35 | 3.15 | 2 | 1 | — |
| FL | Florida | 612 | 2.62 | 3 | 1 | — |
| NY | New York | 514 | 2.59 | 4 | 1 | — |
| UT | Utah | 90 | 2.57 | 5 | 1 | — |
| CA | California | 1,007Highest | 2.55 | 6 | 1 | — |
| CT | Connecticut | 89 | 2.42 | 7 | 1 | — |
| OH | Ohio | 267 | 2.25 | 8 | 1 | — |
| NJ | New Jersey | 212 | 2.23 | 9 | 1 | — |
| MN | Minnesota | 129 | 2.23 | 10 | 1 | — |
| MA | Massachusetts | 158 | 2.21 | 11 | 1 | — |
| MI | Michigan | 210 | 2.07 | 12 | 1 | — |
| MD | Maryland | 129 | 2.06 | 13 | 1 | — |
| AZ | Arizona | 155 | 2.04 | 14 | 2 | — |
| ND | North Dakota | 16 | 2.01 | 15 | 2 | — |
| IL | Illinois | 253 | 1.99 | 16 | 2 | — |
| PA | Pennsylvania | 256 | 1.96 | 17 | 2 | — |
| CO | Colorado | 116 | 1.95 | 18 | 2 | — |
| HI | Hawaii | 27 | 1.87 | 19 | 2 | — |
| VA | Virginia | 164 | 1.86 | 20 | 2 | — |
| NH | New Hampshire | 26 | 1.85 | 21 | 2 | — |
| GA | Georgia | 204 | 1.82 | 22 | 2 | — |
| MO | Missouri | 112 | 1.79 | 23 | 2 | — |
| KS | Kansas | 53 | 1.78 | 24 | 2 | — |
| DE | Delaware | 18 | 1.71 | 25 | 2 | — |
| WI | Wisconsin | 102 | 1.71 | 26 | 2 | — |
| OR | Oregon | 73 | 1.71 | 27 | 3 | — |
| WV | West Virginia | 29 | 1.64 | 28 | 3 | — |
| KY | Kentucky | 75 | 1.63 | 29 | 3 | — |
| TN | Tennessee | 118 | 1.63 | 30 | 3 | — |
| TX | Texas | 499 | 1.59 | 31 | 3 | — |
| NV | Nevada | 51 | 1.56 | 32 | 3 | — |
| WA | Washington | 119 | 1.50 | 33 | 3 | — |
| MS | Mississippi | 44 | 1.50 | 34 | 3 | — |
| NC | North Carolina | 165 | 1.49 | 35 | 3 | — |
| LA | Louisiana | 66 | 1.44 | 36 | 3 | — |
| SD | South Dakota | 13 | 1.41 | 37 | 3 | — |
| SC | South Carolina | 77 | 1.41 | 38 | 3 | — |
| NE | Nebraska | 28 | 1.40 | 39 | 3 | — |
| IN | Indiana | 96 | 1.39 | 40 | 4 | — |
| NM | New Mexico | 29 | 1.36 | 41 | 4 | — |
| IA | Iowa | 40 | 1.23 | 42 | 4 | — |
| AK | Alaska | 9 | 1.22 | 43 | 4 | — |
| AR | Arkansas | 35 | 1.13 | 44 | 4 | — |
| OK | Oklahoma | 46 | 1.12 | 45 | 4 | — |
| ME | Maine | 15 | 1.07 | 46 | 4 | — |
| MT | Montana | 12 | 1.06 | 47 | 4 | — |
| ID | Idaho | 20 | 1.00 | 48 | 4 | yes |
| AL | Alabama | 50 | 0.97 | 49 | 4 | yes |
| VT | Vermont | 6 | 0.93 | 50 | 4 | yes |
| WY | Wyoming | 1 | 0.17 | 51 | 4 | yes |
Underserved jurisdictions under the 1-per-100k threshold
4 jurisdictions rank below the 1 active plastic surgeons per 100,000 residents threshold this study uses to flag underserved jurisdictions. The threshold is a transparent baseline cutoff stated explicitly here — it is not a clinical or regulatory definition. Transparent descriptive baseline cutoff at 1.0 active plastic surgeon per 100,000 residents — the bottom-decile boundary observed in the 2026 NPPES snapshot and aligned with the bottom-decile state-level density bands described in the published plastic-surgery workforce-geography literature (Bauder et al., Annals of Plastic Surgery 2015; ASPS Annual Procedural Statistics workforce reports). HRSA does NOT designate plastic surgery as a HPSA shortage specialty, and ASPS does not publish a regulatory shortage threshold; this cutoff is descriptive only and surfaces states whose density falls in the lowest decile of the observed distribution. Not a clinical, regulatory, or access-modeling standard. The plastic-surgery national density (~2/100k) is roughly 1/14th of the chiropractor national density and 1/3rd of the dermatologist density — the entire distribution sits at workforce-density figures where a 2/100k threshold (which would catch the median) is structurally meaningless.
The states below the threshold collectively hold 8,395,429 residents — about 2.5% of the U.S. population.
Important framing. "Underserved" here means density-below-threshold in the public NPPES dataset. It does not measure new-patient availability, insurance acceptance, sub-specialty match, travel time to the nearest practice, or whether the practice is accepting Medicaid. Network-distance and gravity-model methodologies produce a different, complementary picture — one we explicitly cite below.
Density vs. spatial access: what this study cannot say
Density per 100,000 residents is the most transparent supply baseline. It uses two public datasets, requires no modeling assumptions beyond arithmetic, and can be audited row-by-row in the downloadable dataset. Every reader can audit the numbers themselves.
It is not spatial access. A patient in a rural state and a patient in a metropolitan state both contribute the same "1" to their state's denominator, but their realized access differs by orders of magnitude. Headline figures derived from network-distance models (e.g. "X% of Americans live within Y minutes of a [specialist]") coexist with the present study's state-level density findings — both can be true simultaneously, because density and proximity capture different facets of "access."
The healthcare workforce literature has more advanced approaches:
- Two-Step Floating Catchment Area (E2SFCA) and gravity models treat access as a function of provider supply, population demand, and distance decay. A 2023 review of gravity models for potential spatial healthcare access (open-access spatial-epidemiology literature) is the standard reference.
- Network-based access measures compute drive-time isochrones from each Census tract centroid and count reachable providers within a window.
This study does not implement E2SFCA, gravity, or network distance. It reports state-level density and acknowledges the gap. Readers who need spatial-access estimates should pair our state ranking with the cited literature or specialty-specific access modules in the AAMC State Physician Workforce Data Reports.
Public-health frame
Public-health relevance. The plastic surgery workforce-geography literature documents pronounced concentration in major metropolitan areas. The foundational geographic-variation analysis (Bauder AR, Sarik JR, Butler PD, et al., Geographic variation in access to plastic surgeons, Annals of Plastic Surgery 2015) found rural-state density falling in a 1-2 per 100,000 band while urban-coastal states reported 5-7 per 100,000. Subsequent ASPS workforce reporting and follow-up academic analyses (e.g., reconstructive-microsurgery workforce literature in Plastic and Reconstructive Surgery) reaffirm the maldistribution but consistently note that no federal regulatory framework designates plastic-surgery shortage areas. HRSA's HPSA designation criteria cover primary care, dental, and mental health only.
State-level density is therefore a descriptive structural variable, not a regulatory shortage flag. The bottom-decile states in this study are those where post-mastectomy reconstruction, complex hand surgery, and pediatric reconstructive caseloads are most likely to involve out-of-state referrals or extended wait times — but a low density does NOT carry the federal-shortage-area implication that a primary-care HPSA designation does for primary care.
Citation transparency. This study makes no clinical claims about any individual provider. The geographic-concentration finding is established in the cited workforce literature; we cite it as context for why density matters, not as a finding our dataset proves.
Why this is different: public-records-only, record-level traceable
Most state-level plastic surgery supply numbers in circulation come from one of three places: (1) the AAMC State Physician Workforce reports, which use specialty-society membership and AMA Masterfile cross-references; (2) commercial workforce-data vendors that license those underlying datasets; or (3) press-release figures from advocacy organizations.
This study is different in three concrete ways:
- Single public source family. Everything reported here ties back to the public NPPES API and the public Census Bureau population estimate. Both are free. Both are updated on cadences CMS and Census publish. Anyone with a web browser can re-run the underlying queries.
- Record-level traceability. Every provider in the count has an NPI. The downloadable dataset preserves NPI numbers, the matched state, and the per-state aggregate. A reader auditing a specific state's count can pull the corresponding NPI list, look each one up in NPPES, and audit the active-plastic surgery-taxonomy criterion themselves.
- No quality attestation. Fonteum does not run a checking process for individual plastic surgeons. The label "active in NPPES" describes a CMS registry status, not a quality, board-certification, or insurance-acceptance attestation. Patients who need clinical confirmation should consult the American Board of Medical Specialties (ABMS) registry for board-certification status and their insurer's directory for in-network availability.
The downloadable CSV at the top of this study includes per-state count, density, rank, quartile, and the underserved-threshold flag. The downloadable JSON adds the snapshot metadata and source URLs.
Cite this study
Suggested citation:
Fonteum Research. (2026). National Plastic Surgery Supply by State — NPPES 2026 Snapshot. Fonteum. Retrieved from https://fonteum.com/research/plastic-surgery-supply-by-state-2026
Reuse and attribution. Charts, tables, and the downloadable CSV / JSON may be cited or reproduced with attribution to Fonteum Research and a link to this study. Carry the snapshot date (2026-05-07) so readers know the dataset version. Future NPPES snapshots will produce different state-level counts as providers update their NPPES status.
The methodology, the explicit underserved-threshold definition, and the density-vs-spatial-access distinction must travel with the figures. Per-state counts published without those caveats risk being misread as a clinical-access measurement, which the dataset does not support.
Press / media inquiries. Reach the Fonteum Research team via the brand-hub contact page. We are happy to clarify methodology for health-policy and access-equity reporters; we will not provide patient-side clinical commentary.
Cited literature (suggested for follow-up reading):
- Bauder AR, Sarik JR, Butler PD, et al. (2015). Geographic variation in access to plastic surgeons. — Foundational state-level density analysis identifying the 1-2/100k bottom-decile band and 5-7/100k top-decile band cited as the descriptive-baseline anchor for this study's threshold.
- American Society of Plastic Surgeons (ASPS) Annual Procedural Statistics. — Annual workforce reports + member-density figures used to triangulate the bottom-decile baseline. ASPS does not publish a regulatory shortage threshold.
- U.S. Health Resources and Services Administration (HRSA). HPSA designation criteria. — HRSA HPSA covers primary care, dental, and mental health only; plastic surgery is NOT eligible for HPSA designation. Cited to clarify the regulatory absence.
- American Board of Plastic Surgery (ABPS). — Board certification authority for U.S. plastic surgery. Certification is a separate verification step NPPES does not capture; cited to clarify scope.
- Khansa I et al. workforce literature in Plastic and Reconstructive Surgery (various years). — Follow-up workforce-distribution analyses reaffirming Bauder et al.'s state-level density bands.
Limitations
- Density is not spatial access. Per-100,000 resident density measures supply-to-population ratio at the state level. It does not measure travel time, new-patient availability, insurance acceptance, or sub-specialty match. Network-based and gravity-decay methods (E2SFCA) provide more accurate access measurements. We have not implemented those methods.
- NPPES taxonomies are self-reported. Providers select their own taxonomy codes when registering or updating their NPI. There is no specialty-board cross-check built into NPPES; a board-certified physician and a non-board-certified provider who self-attests the specialty code both appear. Patients confirming clinical credentials should consult ABMS / AOA registries directly.
- Practice Address state, not where the provider lives or practices most. A multi-site practitioner is counted once at their Practice Address state. Cross-state telemedicine practices may be undercounted in the patient-facing state.
- Active-flag accuracy. NPPES updates active/deactivated status as providers self-attest. Some providers carry stale NPIs from earlier career stages. The deactivation flag captures most cases; minor over-counting at the margin is possible.
- Census ACS 2024 vintage uncertainty. State population denominators come from the Census Bureau 2024 V2024 estimate. ACS estimates carry margin-of-error bands; per-100k figures are point estimates from a point-estimate denominator and should not be treated as exact to two decimal places.
- No procedure-mix or sub-specialty breakout. This study does not distinguish sub-specialties beyond what the taxonomy codes encode. A provider's primary clinical practice may differ from their NPPES taxonomy code.
- Type 2 (organization) NPIs excluded. Hospital-employed plastic surgeons who only operate under a Type 2 organization NPI are under-counted. Most plastic surgeons carry both, so the under-count effect is small but non-zero.
- No outcomes / quality-of-care claims. This study reports NPPES-listed counts and Census-derived densities. It makes no claims about practice quality, board certification status, sub-specialty expertise, or any clinical outcome metric. This is not medical advice. Patients should look up board certification through ABMS or AOA, confirm insurance acceptance with the practice, and consult their primary care physician for referrals.
- Snapshot in time. Counts reflect the 2026-05-07 NPPES snapshot. The cached dataset is preserved at
data/nppes/plastic-surgery-2026-05-07.jsonfor re-analysis.
Limitations
- Density is not spatial access. Network-distance / E2SFCA / gravity methods give more accurate access measurements; we have not implemented them.
- NPPES taxonomies are self-reported; there is no specialty-board cross-check.
- Practice Address state is used; cross-state telemedicine practices may be undercounted in the patient-facing state.
- Census 2024 vintage population estimates carry margin-of-error bands; per-100k figures are point estimates from a point-estimate denominator.
- Fonteum does not rate, certify, or guarantee any provider. Patients should consult ABMS / AOA registries for board-certification status and confirm insurance acceptance with the practice directly.
Methodology
Read the full methodology
Data sources. This study uses two public datasets:
- U.S. CMS NPI Registry (NPPES) — public API at
https://npiregistry.cms.hhs.gov/api/?version=2.1, snapshot 2026-05-07. - U.S. Census Bureau Population Estimates Program (PEP) — 2024 Vintage (V2024) state population estimates, released 2024-12-19.
Inclusion criteria. Each provider counted meets all of:
- NPI Type 1 (individual practitioner) — Type 2 (organization) NPIs are excluded.
basic.status = "A"andbasic.deactivation_dateis null.- Carries at least one of the 2 Plastic Surgery Healthcare Provider Taxonomy codes:
208200000X(Plastic Surgery (parent)),2082S0099X(Plastic Surgery within the Head and Neck). - Has a U.S. Practice Address (LOCATION). Mailing-only addresses are not used.
State assignment. Providers are bucketed by their Practice Address state, not their Mailing Address state. Each NPI is counted once.
Density computation. Per-100,000 figures are: (count / Census 2024 vintage population) × 100,000. Underserved threshold: less than 1 active plastic surgeons per 100,000 residents. Transparent descriptive baseline cutoff at 1.0 active plastic surgeon per 100,000 residents — the bottom-decile boundary observed in the 2026 NPPES snapshot and aligned with the bottom-decile state-level density bands described in the published plastic-surgery workforce-geography literature (Bauder et al., Annals of Plastic Surgery 2015; ASPS Annual Procedural Statistics workforce reports). HRSA does NOT designate plastic surgery as a HPSA shortage specialty, and ASPS does not publish a regulatory shortage threshold; this cutoff is descriptive only and surfaces states whose density falls in the lowest decile of the observed distribution. Not a clinical, regulatory, or access-modeling standard. The plastic-surgery national density (~2/100k) is roughly 1/14th of the chiropractor national density and 1/3rd of the dermatologist density — the entire distribution sits at workforce-density figures where a 2/100k threshold (which would catch the median) is structurally meaningless.
What density does not measure. Per-100k density is a supply-to-population ratio at state granularity. It does not measure spatial access, new-patient availability, insurance acceptance, sub-specialty match, board-certification status, or any quality / clinical-outcomes metric. Network-distance and gravity-model approaches (E2SFCA) provide more accurate geographic-access measurements and are explicitly cited above; this study does not implement them.
Differentiation. This is a public-records-only study. The downloadable CSV and JSON preserve NPI numbers and per-state aggregates so any reader can audit individual records against the live NPPES registry. Fonteum does not independently rate, inspect, certify, or guarantee any provider — the label "active in NPPES" describes a CMS registry status, not a quality attestation.
Not medical advice. Patients should consult ABMS / AOA registries for board-certification status, confirm insurance acceptance with the practice directly, and discuss referrals with their primary care physician.
Reproducibility. The cached NPPES dataset at data/nppes/plastic-surgery-2026-05-07.json and the per-state aggregate at public/research/data/plastic-surgery-supply-by-state-2026-05-07.json (also CSV) are the canonical snapshots. The ingestion script and aggregation script are version-controlled under scripts/research/.
Data sources. This study uses two public datasets:
- U.S. CMS NPI Registry (NPPES) — public API at
https://npiregistry.cms.hhs.gov/api/?version=2.1, snapshot 2026-05-07. - U.S. Census Bureau Population Estimates Program (PEP) — 2024 Vintage (V2024) state population estimates, released 2024-12-19.
Inclusion criteria. Each provider counted meets all of:
- NPI Type 1 (individual practitioner) — Type 2 (organization) NPIs are excluded.
basic.status = "A"andbasic.deactivation_dateis null.- Carries at least one of the 2 Plastic Surgery Healthcare Provider Taxonomy codes:
208200000X(Plastic Surgery (parent)),2082S0099X(Plastic Surgery within the Head and Neck). - Has a U.S. Practice Address (LOCATION). Mailing-only addresses are not used.
State assignment. Providers are bucketed by their Practice Address state, not their Mailing Address state. Each NPI is counted once.
Density computation. Per-100,000 figures are: (count / Census 2024 vintage population) × 100,000. Underserved threshold: less than 1 active plastic surgeons per 100,000 residents. Transparent descriptive baseline cutoff at 1.0 active plastic surgeon per 100,000 residents — the bottom-decile boundary observed in the 2026 NPPES snapshot and aligned with the bottom-decile state-level density bands described in the published plastic-surgery workforce-geography literature (Bauder et al., Annals of Plastic Surgery 2015; ASPS Annual Procedural Statistics workforce reports). HRSA does NOT designate plastic surgery as a HPSA shortage specialty, and ASPS does not publish a regulatory shortage threshold; this cutoff is descriptive only and surfaces states whose density falls in the lowest decile of the observed distribution. Not a clinical, regulatory, or access-modeling standard. The plastic-surgery national density (~2/100k) is roughly 1/14th of the chiropractor national density and 1/3rd of the dermatologist density — the entire distribution sits at workforce-density figures where a 2/100k threshold (which would catch the median) is structurally meaningless.
What density does not measure. Per-100k density is a supply-to-population ratio at state granularity. It does not measure spatial access, new-patient availability, insurance acceptance, sub-specialty match, board-certification status, or any quality / clinical-outcomes metric. Network-distance and gravity-model approaches (E2SFCA) provide more accurate geographic-access measurements and are explicitly cited above; this study does not implement them.
Differentiation. This is a public-records-only study. The downloadable CSV and JSON preserve NPI numbers and per-state aggregates so any reader can audit individual records against the live NPPES registry. Fonteum does not independently rate, inspect, certify, or guarantee any provider — the label "active in NPPES" describes a CMS registry status, not a quality attestation.
Not medical advice. Patients should consult ABMS / AOA registries for board-certification status, confirm insurance acceptance with the practice directly, and discuss referrals with their primary care physician.
Reproducibility. The cached NPPES dataset at data/nppes/plastic-surgery-2026-05-07.json and the per-state aggregate at public/research/data/plastic-surgery-supply-by-state-2026-05-07.json (also CSV) are the canonical snapshots. The ingestion script and aggregation script are version-controlled under scripts/research/.
Technical appendix
Show technical details · script paths · field names
Ingestion. scripts/research/nppes-by-taxonomy-ingest.ts plastic-surgery paginates the NPPES public API per state × per plastic surgery-taxonomy-description. The API caps any single query at 1,200 results (skip 0..1000, limit 200). For state×taxonomy combinations that saturate the cap, the script falls back to a recursive ZIP-prefix split: 100 two-digit prefixes per saturated query, recursing to three-digit prefixes if needed. Results are deduplicated by NPI across taxonomy queries and ZIP-prefix splits.
Filters applied at ingestion.
enumeration_type === "NPI-1"(individual practitioners)basic.status === "A"ANDbasic.deactivation_dateis nulladdresses[].address_purpose === "LOCATION"ANDcountry_code === "US"(Practice Address)- At least one taxonomy code in {208200000X, 2082S0099X}
Aggregation. scripts/research/specialty-supply-aggregate.ts plastic-surgery reads the cached NPPES JSON and the static scripts/research/census-state-pop-2024.json (Census 2024 V2024 estimates). For each state it computes count, per-100k density, density rank, count rank, quartile-by-density, and the underserved flag. Output:
public/research/data/plastic-surgery-supply-by-state-2026-05-07.json— full row-level dataset + summary metadatapublic/research/data/plastic-surgery-supply-by-state-2026-05-07.csv— same data in CSV form
Chart. scripts/research/build-specialty-supply-chart.ts plastic-surgery emits the hand-coded SVG at public/research/charts/plastic-surgery-supply-by-state-2026/state-ranking-by-density.svg. Palette pulled from src/lib/research/chart-theme.ts (§133). No charting library; no Plotly defaults.
Doctrine references. §95 (NPPES ingestion), §126 (newsroom + AI-citation readiness), §181 (NPPES dermatology supply by state — first full-source-enumeration study), §182 (specialty-study factory — this study generated through the factory).
Open for the script paths, raw dataset filenames, and per-field aggregation rules behind this snapshot. Reader-facing methodology above already covers source, date, and limitations.
Directory
Find a plastic surgeon near you
Browse our directory of listed plastic surgeons across thousands of cities. Compare ratings, read reviews, and connect directly.
Explore Plastic Surgeons